How many of these have you spotted in the wild? And which obvious ones did I miss?
Operational Metrics
- Work in progress, by resource, team, project, and sprint
- Capitalizable time ratios for developers and teams (e.g. capex vs. opex)
- Cycle time, in-cycle churn, lead time
- Queue size by project and teams (measured in number of issues, story points and estimations)
- Planned vs. unplanned work
Quality Metrics
- Number of defects per team, sprint or iteration
- Open defect count by severity
- Test automation coverage % (based on developer surveys, not tooling)
- Average time to resolve by project, team, component, etc.
- Estimated total time to resolve
- Number and severity of client-reported defects over time
Development Metrics
- Check-in size, frequency
- Velocity / throughput
- Unit-test code coverage %
- % of time in a deployable state
- Groomed backlog length, based on team’s historical velocity
- Time to zero backlog
Product Metrics
- Product Metrics
- Activations
- Acquisition funnel
- Referrals
- Satisfaction Survey & NPS
- Retention rate
- Churn
- Session interval & length

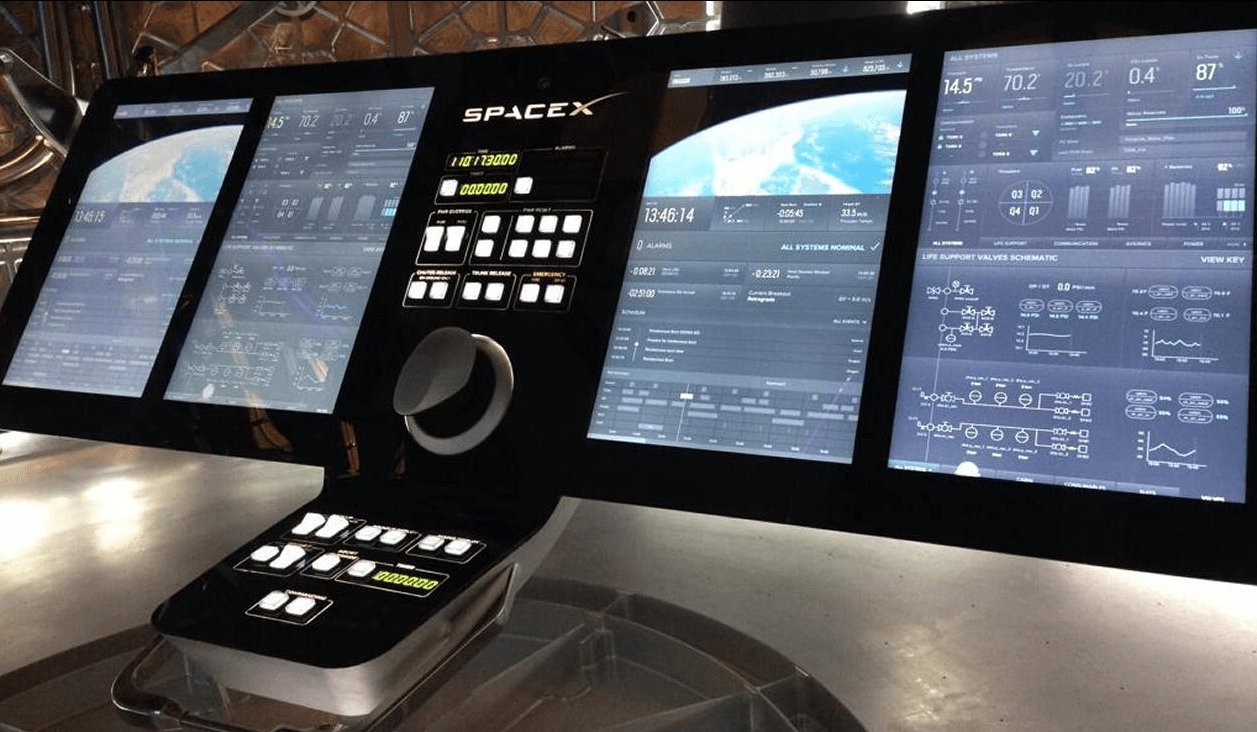
The STS (Space Transportation System) flight console for comparison. The space shuttle, while a significant scientific and engineering accomplishment, was a classic example waterfall project management and suffered accordingly. It utilized a design-by-committee (Congressional, in this case) approach with gold plated requirements baked in early that required significant shifting of the goal posts to achieve, and ultimately failed its original purpose of lowering costs to orbit through amortization and frequent launches. KPIs include an astonishingly high $450M per mission spend for a “reusable” craft, and payload-to-LEO cost rising from an originally estimated $1,600/kg to a whopping $272,000/kg (in 2017 dollars).
